Maximizing capital efficiency for Banks & Insurers through Integrated Portfolio Management and Marginal Capital Rates.
Many financial institutions are leaving significant value on the table. Decisions regarding Strategic Asset Allocation (SAA), product pricing, and risk mitigation are often made using siloed risk assessments—broken down by business line, product type, or risk category.
This fragmented approach frequently overlooks the crucial diversification benefits across portfolios and products. The result? Suboptimal capital deployment, excessive capital buffers, and missed opportunities for value-enhancing internal or external risk transfers. There is hidden value trapped within the balance sheet, waiting to be unlocked with the right key.
The Paradigm Shift: From Silos to Integration
Integrated Portfolio Management (IPM) offers a contrasting, holistic methodology. Instead of aggregating the capital required for individual risks standalone, IPM begins with the total aggregated portfolio capital and decomposes it to reveal its underlying drivers. Rather than asking: "How much capital does this component need standalone?", IPM asks: "How much does this component contribute to the total capital?"
This decomposition methodology provides a unified, risk-adjusted view of the consolidated balance sheet. This approach is highly relevant for insurers managing Solvency II capital and banks managing interest rate and credit spread risks in the banking book (IRRBB/CSRBB).
The Engine of Efficiency: Diversification and Marginal Capital Rates
The core advantage of IPM lies in how it treats diversification. When you simply add up all standalone capital components, you inevitably overstate the real portfolio requirement because diversification reduces the total capital need:$$Capital_{Total} \leq \sum_{i=1}^{N} Capital_{i}$$
Here Capitali denotes the capital for a sub-portfolio of the total balance sheet which in total consists of N underlying portfolios. The difference between the CapitalTotal and the sum of the underlying capitals is due to diversification: some risks offset each other, reducing the total capital requirement. Diversification between portfolios arises from the imperfect correlation of risks across three main dimensions:- Risk Types: Diversifying exposures across market risks, non-market risks and behavioral risks, and between various sources of risks.
- Business Lines/Products: For consolidated groups, diversification benefits mean the total capital required is lower than the sum of its individual units. This offers opportunities for risk transfers and a Group Strategic Asset Allocation for optimally using the available risk budget.
- Geographies: Spreading risks across different regions and countries can mitigate the impact of localized economic or political events.
Marginal Capital Rates
To measure and improve capital efficiency, we use the Total Capital Decomposition based on an Euler allocation. For the total exposure X = X1 + ... + XN, Euler’s theorem guarantees that the sum of the allocated capital amounts will exactly equal the total diversified capital (CapitalTotal). This is formally expressed as:$$Capital_{Total} = \sum_{i=1}^{N} \frac{\partial Capital_{Total}}{\partial X_i} \cdot X_i = \sum_{i=1}^{N} MCR_i \cdot X_i$$
The Marginal Capital Rate, MCRi = ∂CapitalTotal / ∂Xi, is the core metric here. It represents how much the total capital changes if you add one more unit of the current exposure Xi. It directly reveals which risks are truly capital-intensive versus diversifying:- High MCRi ("Risk Drivers"): Exposure drives total capital, often correlated with other tail risks.
- Low MCRi ("Diversifiers"): Exposure diversifies the portfolio, adding return without consuming much capital.

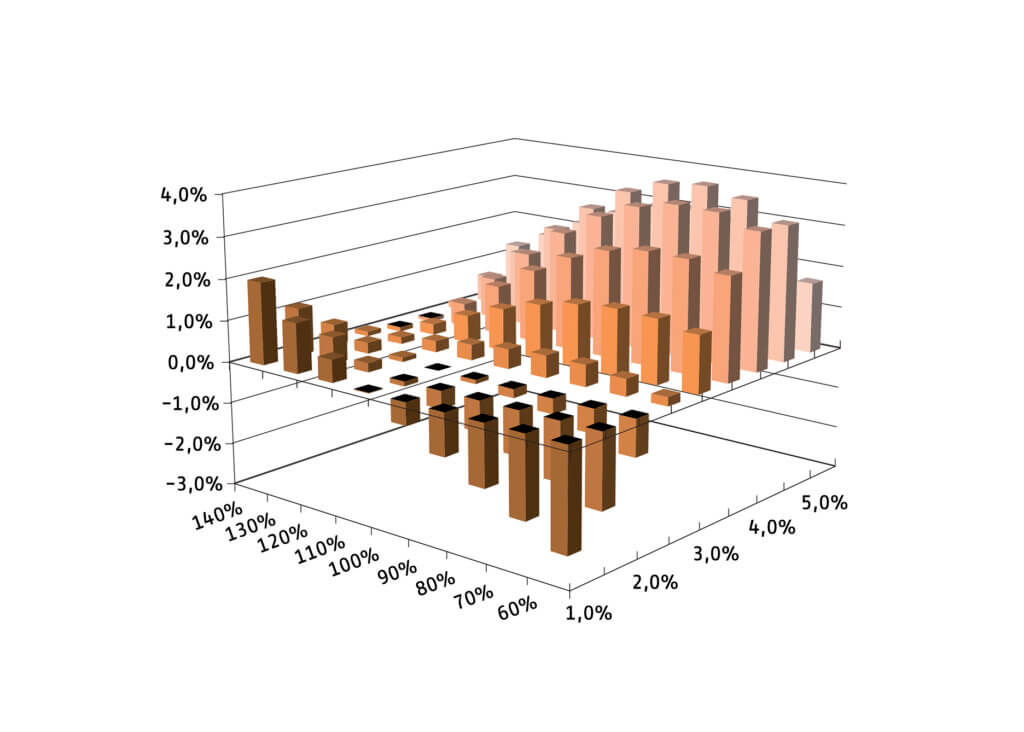
Figure 1: Marginal Capital Rates enable the distinction between tail risk drivers and balance sheet diversifiers.
Ensuring Stable Insights
In diversified balance sheets, the specific risk factor (e.g., interest rates, spread or FX movements) or portfolio that causes the extreme loss event often varies significantly from one tail scenario to the next. To achieve stable capital attribution, we must therefore avoid relying on a single, unweighted point estimate, and instead look at the average contribution across a wider range of tail scenarios.
To address this issue, we use the non-parametric Harrell–Davis method. Instead of relying on a single data point, this estimator computes the quantile as a weighted linear combination of all ordered scenarios \( X_{i} \). The weights \( W_{i} \) itself are derived directly from the cumulative distribution function of the Beta distribution:
$$W_{i} = I_{i/n}(\alpha, \beta) - I_{(i-1)/n}(\alpha, \beta)$$
Here, \( I \) denotes the Regularized Incomplete Beta Function. The shape parameters are defined by the target quantile \( q \) and sample size \( n \), where \( \alpha = (n+1)q \) and \( \beta = (n+1)(1-q) \).
By spreading weights across multiple scenarios, this approach smooths the empirical distribution to ensure stable capital contributions. This improves the robustness of capital decompositions and portfolio look-throughs, while simultaneously enhancing scenario convergence.
The Goal: Optimizing Risk-Adjusted Returns
Ultimately, the MCRi empowers managers to precisely calculate and optimize Risk-Adjusted Return on Capital (RAROC) for any given position. By contrasting expected returns against the actual marginal capital consumed, MCR reveals the true efficiency of every asset.
This allows managers to steer allocations toward the highest value-generating activities, which lays the groundwork for smarter Strategic Asset Allocation (SAA), more accurate product pricing, hedging and efficient risk transfers.

Figure 2: By balancing expected returns against Marginal Capital Rates, the optimization process steers allocations and risk transfers toward the highest value-generating activities.
Real-World Applications
In our work with insurers and banks, we have applied Integrated Portfolio Management and marginal capital rate approaches across a range of real-world situations:- Strategic Asset Allocation (Group SAA): Optimizing portfolio returns within risk budgets by clearly identifying which exposures drive capital consumption versus those that provide diversification benefits.
- Product Pricing: Integrating the true cost of capital into pricing to reflect risk-adjusted returns—crucial for competitive pricing in life insurance products and mortgages (including prepayment risks).
- Risk Transfer Structuring: Structuring efficient internal or external risk transfers, such as pricing longevity reinsurance deals by accurately accounting for their impact on the total group cost of capital.
- Balance Sheet Management: Using look-through insights to optimize hedging strategies and align product pricing incentives with overall group capital efficiency.